ABC Analysis in Inventory Management: A 2026 Guide for Indian Retailers
What ABC analysis is, how to run it on your inventory in five steps, and why cloud retail ERPs are turning it from a once-a-year Excel exercise into a continuous strategic tool.
Table of Contents
What is ABC analysis?
The 80-15-5 split rule
Why ABC analysis matters more for Indian retail in 2026
How to do ABC analysis in 5 steps
ABC analysis examples across Indian retail verticals
ABC vs XYZ vs HML vs FSN - when to use which
From quarterly Excel to real-time automation
5 common mistakes Indian retailers make with ABC analysisWhere ABC fits in a 2026 inventory strategy
TL;DR
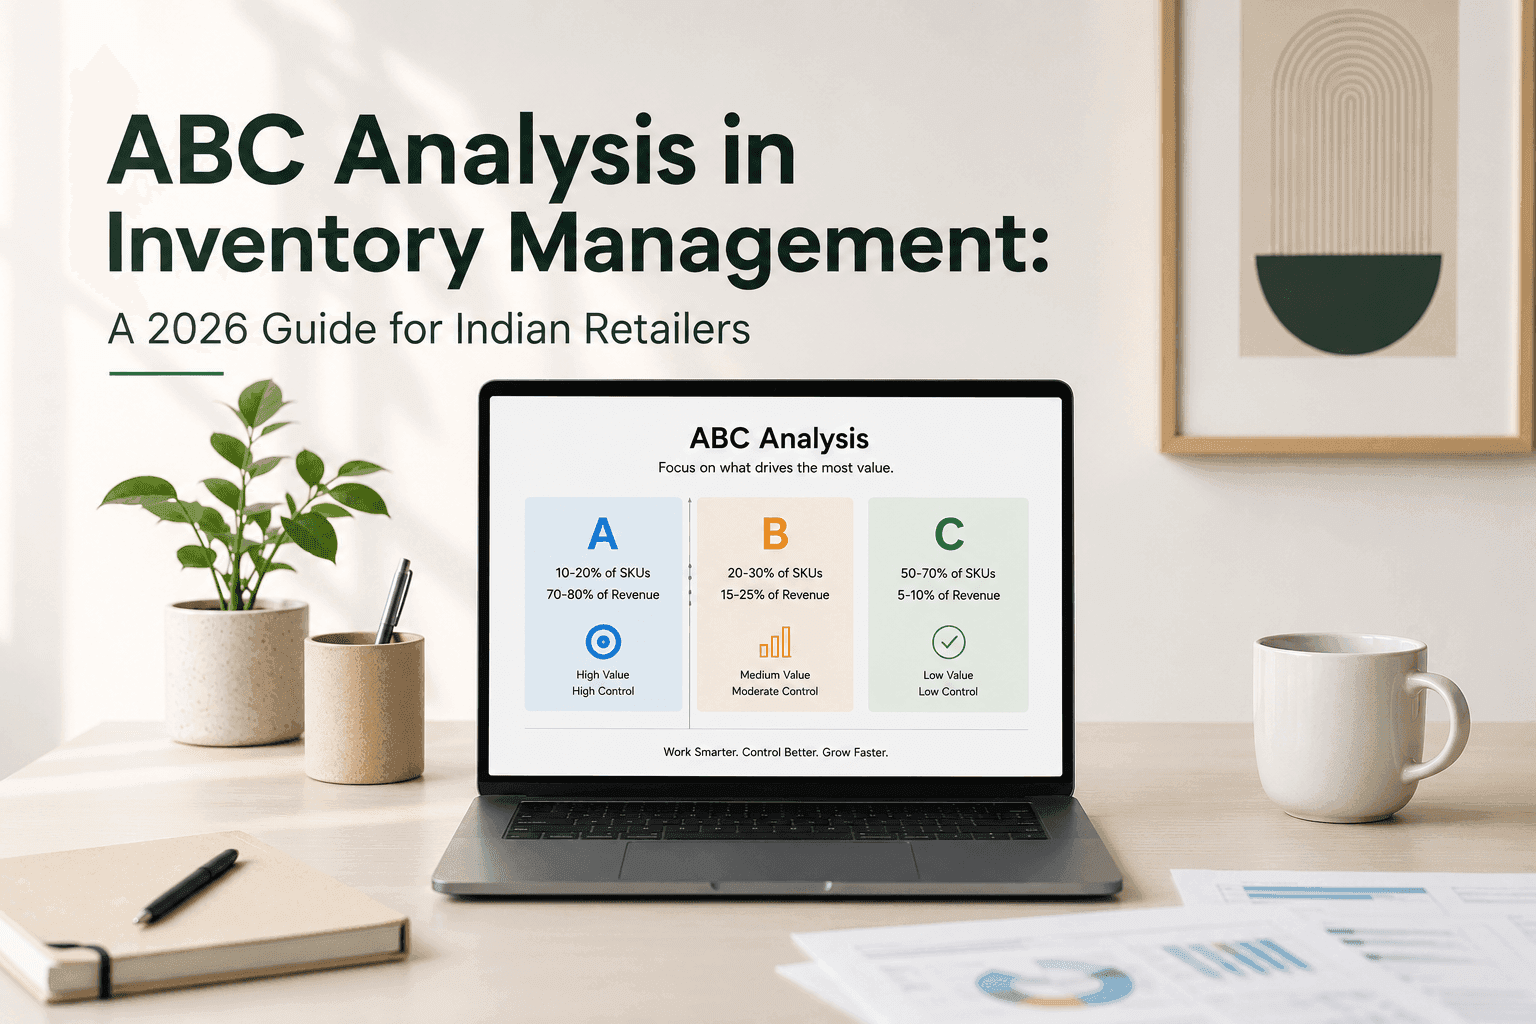
ABC analysis is a Pareto-based technique that classifies inventory into three groups by economic importance: A items (the top ~20% of SKUs that drive ~80% of revenue), B items (~30% of SKUs driving ~15% of revenue), and C items (the remaining ~50% driving ~5%). Indian retailers use it to focus operational attention where it matters, tighter forecasting, stricter reorder controls, and faster review cycles for A items; lighter handling for C items.
In 2026, the technique itself hasn't changed. What has changed is how it's run. Cloud retail ERPs now reclassify inventory continuously, replacing the quarterly Excel exercise most Indian retailers still depend on.
What is ABC analysis?
ABC analysis is an inventory categorisation method based on the Pareto principle, the empirical observation that roughly 80% of effects come from 20% of causes. Applied to inventory, the principle states that a small fraction of SKUs typically account for the majority of revenue, profit, or movement.
Once each SKU is classified as A, B, or C, retailers apply different control standards to each category:
A items: tight inventory control, frequent cycle counts, automated reorder triggers, senior-management attention.
B items: moderate control - periodic review, standard reorder points, monthly cycle counts.
C items: loose control - bulk ordering, infrequent counting, lighter forecasting effort.
The point is not that C items don't matter. It's that spending equal effort across every SKU is wasteful. ABC analysis gives you a defensible rule for where to spend operational attention.
The 80-15-5 split rule
The textbook ratios most Indian retailers use:
Category | % of SKUs | % of Annual Revenue |
A | 10-20% | 70-80% |
B | 20-30% | 15-25% |
C | 50-70% | 5-10% |
These ratios are guidelines, not absolutes. A specialty electronics retailer may find A items represent only 5% of SKUs but 90% of revenue. A grocery store usually has a flatter distribution. Always run your actual numbers, don't assume the textbook ratios apply to your business.
Why ABC analysis matters more for Indian retail in 2026
Three structural realities make ABC analysis more valuable now than it was a decade ago.
SKU counts have exploded. A mid-market apparel retailer carries 5,000-15,000 SKUs. An electronics chain carrying multiple smartphone, TV, and appliance brands easily crosses 8,000 unique SKUs. Without classification, that volume becomes ungovernable, you end up either over-managing low-value items or under-managing high-value ones.
Margins are tighter. With quick commerce competing on speed and online marketplaces compressing prices, the cost of holding dead stock or stocking out on a top-mover is no longer absorbed easily. A single A-item stockout during a Friday evening rush can cost more revenue than an entire week of C-item sales.
Multi-channel selling demands precision. When the same SKU sells across your store, your website, Amazon, Flipkart, and a quick-commerce listing, you need to know which units are A-category (constant attention, daily syncing) versus C-category (weekly batch updates are fine). ABC classification becomes the basis for differentiated channel strategy.
How to do ABC analysis in 5 steps
The standard procedure, adapted for Indian retail.
Step 1: Pull your inventory data
Export every SKU with two pieces of data, annual unit sales and unit cost. Most cloud ERPs let you pull this in one report. If you're on Tally or BUSY, you'll need to combine an item-master export with a sales register.
Step 2: Calculate Annual Consumption Value (ACV)
For each SKU:
ACV = Annual Unit Sales × Unit Cost
This gives you the rupee-impact of each item over a year. Many Indian retailers mistakenly use revenue or quantity alone, neither is sufficient. ACV captures both how often an item moves and how much capital it ties up.
Step 3: Sort and calculate cumulative percentage
Sort all SKUs by ACV in descending order. Calculate each item's share of total ACV, then build a running cumulative percentage column.
Step 4: Apply the cut-off rules
Top SKUs whose cumulative share reaches 70-80% of total ACV = A items
The next batch up to 80-95% = B items
The remaining 95-100% = C items
Step 5: Apply differentiated control standards
This is where most Indian retailers fall short. Classification without differentiated control gives you nothing. For each category, set distinct rules: reorder frequency, safety stock, cycle-count cadence, and approval workflows for purchase orders.
ABC analysis examples across Indian retail verticals
Three illustrative examples showing how the classification typically plays out.
Electronics retailer (mid-sized phone and accessories shop in Mumbai)
A retailer carrying 1,200 SKUs - phones, chargers, cases, earphones, smartwatches - typically finds:
A items: the latest iPhone, top-end Samsung and OnePlus flagships, and 2-3 high-margin accessory bundles. Roughly 8% of SKUs, ~75% of revenue.
B items: older phone models, mid-range wearables, mainstream cable and charger brands. About 22% of SKUs, ~18% of revenue.
C items: discontinued phones, low-margin small accessories, slow-moving cases. About 70% of SKUs, ~7% of revenue.
Operational implication: A items get serial-number-tracked inventory and daily reorder review. C items get loose tracking and quarterly clearance.
Apparel chain (5-store fashion retailer in Delhi NCR)
For 8,000 SKUs across t-shirts, jeans, dresses, and accessories:
A items: the season's top-selling colours and sizes - about 15% of SKUs, 78% of revenue.
B items: secondary colours, less-popular sizes, basics - around 30% of SKUs, 17% of revenue.
C items: previous-season carryovers, edge-case sizes, accessories - 55% of SKUs, 5% of revenue.
Operational implication: A items demand size-by-colour replenishment forecasting and never go out of stock. C items get marked down quarterly to free up shelf space.
Supermarket (mid-sized grocery chain in Pune)
Across 12,000 SKUs:
A items: atta, dal, oil, sugar, milk, top-3 detergent brands, top-5 personal-care brands. Around 5% of SKUs, 65% of revenue.
B items: secondary FMCG, branded snacks, beverages. Roughly 25% of SKUs, 25% of revenue.
C items: niche imports, slow-moving packaged foods, specialty items. 70% of SKUs, 10% of revenue.
Operational implication: A items get auto-replenishment, daily cycle counts, and never-out-of-stock guarantees. C items get bulk ordering on quarterly cycles.
ABC vs XYZ vs HML vs FSN - when to use which
ABC is one of several inventory classification techniques. Each classifies on a different axis, and mature inventory teams combine them.
Technique | What it classifies on | Best used for |
ABC | Annual consumption value (revenue or cost impact) | Where to focus operational attention |
XYZ | Demand variability / predictability | How much safety stock to hold |
HML | Unit cost (high / medium / low) | Procurement and storage strategy |
FSN | Movement velocity (fast / slow / non-moving) | Identifying dead stock |
A mature Indian retailer often runs ABC + FSN together. ABC tells you which items deserve attention; FSN tells you which items are dying. An "A-N" item, high revenue but suddenly non-moving, is an immediate red flag, often signalling a discontinued brand or a quality issue worth investigating before it becomes write-off territory.
From quarterly Excel to real-time automation
For most Indian retailers, ABC analysis is still a once-a-year exercise. The ops team exports inventory data, builds a pivot table, classifies SKUs, sends a memo to procurement, and the document is forgotten until next year.
This is the biggest weakness of how ABC is practised today, because demand patterns shift in months, not years. A new iPhone launches in October and reshuffles your A-list overnight. A summer-only apparel SKU that was a B in April becomes a C in November.
Cloud retail ERPs in 2026 reclassify SKUs continuously. As sales come in, the system recalculates ACV in real time, surfaces every SKU that has crossed a category boundary, and flags it for the ops team. The classification becomes a live operational signal rather than a static report.
This shift from periodic to continuous, is what separates retailers running modern inventory management in 2026 from those still treating ABC as a quarterly project.
5 common mistakes Indian retailers make with ABC analysis
1. Using only revenue, not consumption value. Revenue ignores cost. A high-ticket item sold rarely (one fridge a month) may show up as A by revenue but is actually a B by ACV once turn-rate is factored in.
2. Running it annually instead of monthly or quarterly. Demand patterns shift faster than annual cadence can capture. Top retailers re-run ABC at least quarterly; the best do it monthly.
3. Not segmenting by store or channel. A SKU that's an A in your Bangalore store may be a C in your Patna store. Running one combined analysis hides this variance and leads to wrong replenishment rules.
4. Treating C items as throwaway. C items still need to be stocked, they protect range completeness and customer experience. The lesson is to spend less attention on them, not less stock.
5. Failing to act on the classification. The biggest mistake is doing the analysis and then applying the same control standards to A, B, and C items anyway. Without differentiated control rules, classification is just paperwork.
Where ABC fits in a 2026 inventory strategy
ABC analysis is foundational, but it's not the whole strategy. Combined with FSN (to flag dead stock), XYZ (to size safety stock), and EOQ (to optimise order quantities), it gives you a complete inventory framework.
The retailers who win in 2026 don't just run these analyses. They run them automatically, continuously, on cloud retail ERPs that recompute in real time as sales hit the system. The strategic role of the inventory manager has shifted, from running the spreadsheet to acting on the alerts.
See ABC Analysis run live on your retail data
This article walked through ABC analysis as a once-a-year discipline. The version built into Peddle Plus One runs it continuously, every transaction recalculates ACV, every cross-over triggers an ops alert, every category change feeds directly into your reorder rules and channel-sync logic.
In a focused 20-minute session, our inventory team will:
Run live ABC classification on a real Indian retailer's data (anonymised), so you see exactly how A, B, and C boundaries hold up against your kind of business
Show how cross-over alerts surface in real time when an A item slips toward B, or a C suddenly behaves like an A
Walk through how the classification ties into replenishment, multi-channel sync, and dead-stock workflows
Sketch what bringing this onto your own inventory would look like - timeline, data prep, and what your ops team would do differently from week one
No slide deck. No follow-up sequence unless you ask for one.
Book a Peddle Plus inventory session →
Frequently Asked Questions
What is ABC analysis in inventory management?
ABC analysis is a Pareto-based inventory categorisation method that classifies SKUs into three groups by economic importance - A items (the top ~20% of SKUs driving ~80% of revenue), B items (~30% of SKUs driving ~15% of revenue), and C items (the remaining ~50% driving ~5%). Retailers apply differentiated control standards to each category: tight controls on A items, lighter handling for C items.
How do you calculate ABC analysis?
Multiply each SKU's annual unit sales by its unit cost to get its Annual Consumption Value (ACV). Sort all SKUs by ACV in descending order, calculate each item's cumulative percentage of total ACV, then apply cut-offs: top items reaching 70–80% of ACV are A, the next reaching 80-95% are B, and the remainder are C.
What's the difference between ABC and XYZ analysis?
ABC classifies inventory by economic value (annual consumption value), telling you where to focus operational attention. XYZ classifies by demand variability, telling you how much safety stock to hold. Mature inventory teams combine both: an A-X item is high-value and predictable; an A-Z item is high-value but volatile and needs more safety stock.
How often should ABC analysis be run?
For Indian retailers in 2026, quarterly is the minimum; monthly is the best practice. Demand patterns shift fast, new product launches, festival seasons, channel changes and SKUs cross category boundaries within months. Cloud retail ERPs now reclassify SKUs continuously as transactions occur, eliminating the need for periodic batch exercises altogether.
What are common mistakes retailers make with ABC analysis?
Five common mistakes: using only revenue (not ACV) as the classification basis; running ABC once a year instead of monthly or quarterly; not segmenting by store or channel; treating C items as throwaway rather than just lower-attention; and failing to apply differentiated control standards after classification, which makes the entire exercise effectively pointless.

Tamanna Bhardwaj
EditorContent Strategist at Peddle Plus with 4+ years of experience in brand growth and marketing, specializing in retail technology, ERP adoption, and business operations for Indian SMEs.